

Economic Overview
Global markets saw good gains in Q4 25, which topped off another positive year with many indices finishing 2025 near record or multi-year highs. It was also the first year in a while that US stocks were significantly outperformed by non-US stocks. There were various factors that saw the rest of the world outperform the US, more attractive valuations, a weaker US dollar, and a rotation away from US tech. All three contributed to higher gains in Europe, Asia and emerging markets. Overall, stockmarkets were supported by solid earnings growth coupled with easing inflationary pressures and ongoing expectations that central banks, led by the US Federal Reserve would continue to lower interest rates in the year ahead.
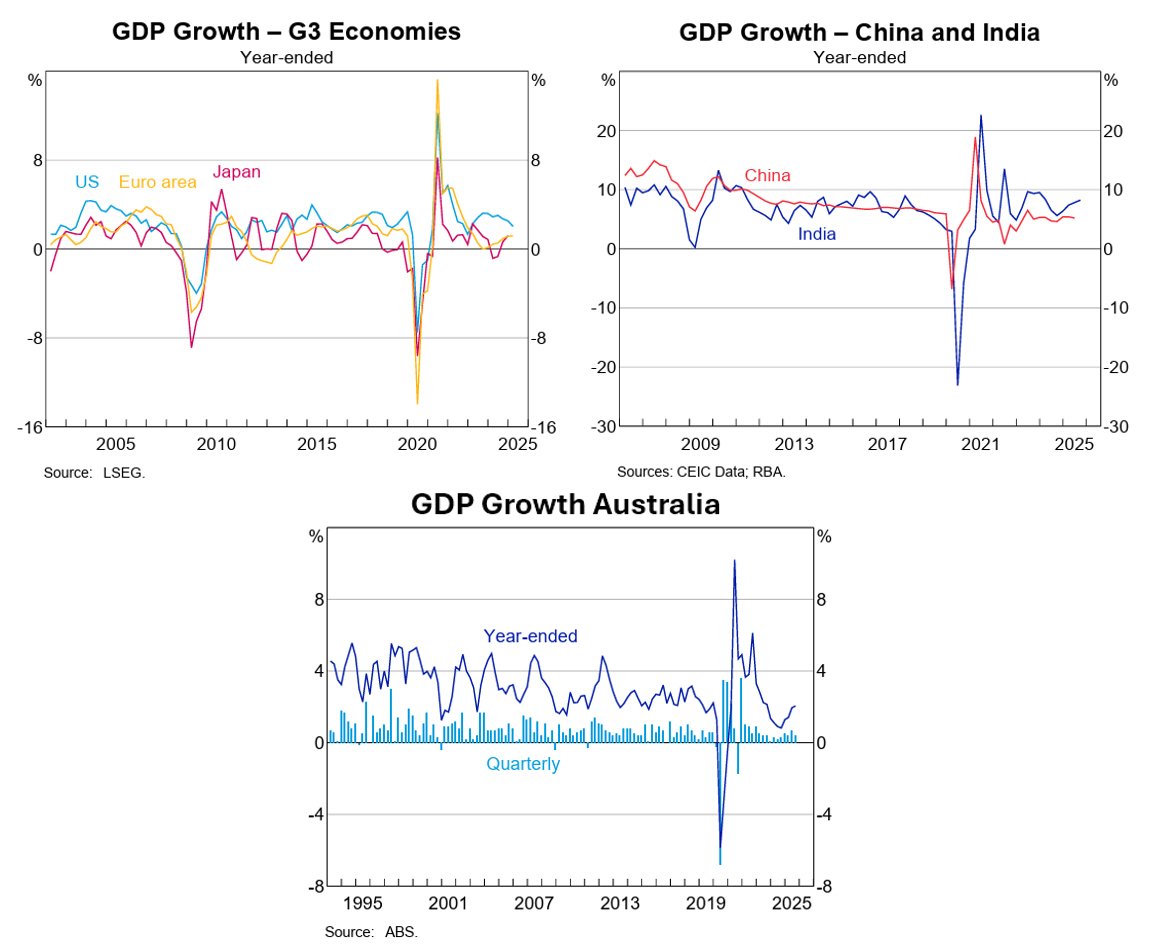
In the US, GDP came in at an annualised rate of 4.3% for Q3 2025, with consumer spending and AI driven investment providing strong support. However, it’s important to remember there was a 43-day government shutdown which means potential gaps in the source data and revisions will likely be notable. The shutdown was due to a failure to pass appropriations for fiscal year 2026. The core reasons being Senate Democrats demanding an extension of Affordable Care Act premium tax credits. The compromise extended funding until January 30, 2026, with a December vote on health care subsidies. Nearly one million federal employees were furloughed. Two million worked without pay during the shutdown. Essentials such as Social Security, Medicare, Transportation Security Administration, and military continued, but many agencies like National Institutes of Health and Centers for Disease Control were in partial or full suspension.
With those caveats in mind, the GDP figure was the highest since Q3 2023, with strong consumer spending, exports and increased government spending. However, business investment slowed, residential investment fell for the fifth straight quarter, and labor market indicators weakened.
Household spending was resilient despite weakening confidence and higher unemployment. Consumer spending increased in both goods and services. Within services, health care and other personal services were the primary drivers. On the goods side, recreational goods and vehicles, along with other nondurable items, led the gains. Overall, personal consumption contributed 2.39 percentage points to GDP. Capital expenditure growth moderated, yet AI-related investments in data centers, intellectual property, and equipment continued to provide meaningful support, reinforcing technology as an ongoing pillar of economic growth.
The unemployment rate increased to 4.6% in November 2025 from 4.4% in September, above market expectations of 4.4% and the highest level since September 2021. The number of unemployed stood at 7.8 million. The November jobs report reinforced the view that hiring demand is gradually cooling rather than rolling over. Job growth has moderated, wage pressures continue to ease, and there remains little evidence of broad-based layoffs across the economy.
U.S. inflation eased to 2.7% in December, the lowest since July and below forecasts, but again there are warnings the decline can be largely attributed to data gaps caused by the government shutdown. Missing October rent data and delayed November price checks, especially in housing, which is a third of the Consumer Price Index, will distort readings for months. Even so, the Federal Reserve cut rates by 0.25% in December, bringing the target range to 3.5%–3.75% as the labour market cooled.
Home sales increased in November for the third consecutive month as easing mortgage rates injected momentum into what’s been a stagnant housing market. Many prospective buyers are still frustrated by high home prices and uncertainty about job security, making them hesitant to commit to major purchases. Inventory trends remain mixed. The number of homes for sale fell 5.9% from October but rose 7.5% compared with November 2024.
Source: RBA 2026
In the Eurozone, economic conditions remained mixed, with Q3 GDP up 0.3% for the quarter and 1.4% over the year. Manufacturing activity continued to contract, especially in Germany, and that negatively affected export focused sectors. Services remained strong and that helped overall business activity expand. Employment was stable, with hiring remaining strong in services even as the jobs market for manufacturing softened. Inflation pressures eased, with the European Central Bank leaving rates unchanged in December, while noting they’d keep watch on growth and price trends. Inflation is projected to decrease from 2.1% in 2025 to 1.9% in 2026, 1.8% in 2027, before rising to the ECB’s medium term target of 2% in 2028.
The ECB’s December 2025 projections revised the GDP growth forecast for the eurozone to 1.4% for the full year 2025, up on the previous estimate of 1.2%. The improved outlook, resilient labor markets and a mild recovery in bank lending, underpinned investor confidence. Domestic demand should remain the main driver of euro area growth, bolstered by rising wages and low unemployment. Additional government spending on infrastructure and defense is also expected to support the domestic economy.
In the UK, annual inflation eased throughout the quarter with the annual readings dropping to 3.6% in October and 3.2% in November. This was the lowest figure since March and was lower than the Bank of England’s forecast of 3.4%. With the easing inflation the BoE cut its bank rate in December by 0.25% to 3.75%, this is the lowest level since 2022. There wasn’t a clear consensus on the cut with five board members voting for the cut, with four voting to holding rates. This split prompted traders to scale back expectations for any further near-term rate cuts. GDP expanded by 0.3% month-on-month in November 2025, rebounding from a 0.1% contraction in October. Year on year the November figure was 1.4%, higher than market expectations of 1.1% growth, but has been under 2% for all of 2025. Politically, the Labour party and Prime Minister Kier Starmer continue to be on the nose with the UK public. At not even a year and a half in office, Starmer hit a record low 18% favourability rating, as measured by YouGov.
In Japan, Q3 2025 GDP came in at 1% on year on year, this was down from the revised 2% Q2 figure. Core inflation, excluding fresh food but including energy, was up 3% annually in both October and November. The numbers were in line with market expectations, but remained well above the Bank of Japan’s 2% target, increasing the chance of an interest rate hike which was confirmed at the BoJ’s December meeting. The BoJ raised its policy rate by 0.25% to 0.75% at its December meeting, which was the highest level since 1995, they also signalled the potential for further increases in 2026. Domestically, Sanae Takaichi’s election as Prime Minister along with the formation of a coalition government between the Liberal Democratic Party and the Japan Innovation Party were taken as signs of increasing political stability.
In China, the year ended on a cautious note with GDP tracking around 5%, supported by exports and stimulus, but domestic demand remains subdued. Industrial output was up 4.8% year on year in November, with retail sales growing just 1.3%. Inflation pressures are minimal: December CPI snuck up 0.1%, while the producer price index fell -2.3%, the 27th consecutive month price decline. Monetary and fiscal policy remains accommodative, with easing to counter ongoing property related stress and deflation risks. Weak housing, soft consumer sentiment, and heavy reliance on external demand look to be ongoing headwinds. Exports in 2025 were surprisingly resilient, despite U.S. tariff actions. While shipments to the U.S. fell nearly 20%, exports to other markets more than offset the decline. This pushed China’s trade surplus above $1 trillion. Geopolitically, China launched “Justice Mission 2025,” in December. This was the largest military exercise around Taiwan since 2022.
In Asia (ex-Japan & China) and Emerging markets, easing US monetary policy was yet another positive in a strong year for emerging markets, as the US Federal Reserved lowered interest rates again in December. Commodities were also a boon, as gold continued to rise, while copper climbed to record highs which were positives for South Africa and Chile. South Africa also saw an interest rate cut in November, while its medium-term budget statement was well-received by the market. Southeast Asian countries, including Indonesia, Malaysia and the Philippines saw resilient domestic demand and improving local economic conditions. Oil prices also declined through the year, down nearly 20% and the sharpest annual decline in oil prices since 2020, while great for motorists, it was a drag on oil reliant economies such as Saudi Arabia.
Back in Australia, data released in December showed GDP increasing by 0.4% for Q3, below forecast and down on the upwardly revised Q2 figure of 0.7%. Year on year GDP growth end of Q3 sat at 2.1%, which was the fastest growth in two years. GDP per capita, noted as a proxy for living standards, was flat for the quarter, but up 0.4% year on year.
The Australian Bureau of Statistics transitioned from a quarterly to a monthly CPI as Australia’s primary measure of inflation during the quarter. CPI increased 3.8% in the 12 months to October 2025, up from 3.6% in the 12 months to September 2025. The largest contributors to annual inflation were housing 5.9%, food and non-alcoholic beverages 3.2%, and recreation and culture 3.2%. The RBA kept the cash rate on hold during the quarter, but the expectations on the direction of the next move shifted with the October inflation reading putting a scare through markets (and mortgage holders). While there had been ongoing suggestions further rate cuts were ahead, the prospect of rate cuts was diminished after the October CPI number. This data was released late November, just prior to the RBA’s December meeting and in it’s statement noted while inflation had fallen substantially since 2022, it had picked up recently and “the recent data suggest the risks to inflation have tilted to the upside, but it will take a little longer to assess the persistence of inflationary pressures.”
House prices increased in every Australian market except regional NT over Q4 2025, with momentum building from lower price points. Cotality noted, “Lower quartile home values have recorded substantially stronger growth in values through the year as competition heats up across the lower price segments of the housing market.” This can likely be attributed to the Labor Government expanding minimum deposit and lenders mortgage insurance schemes with higher house price caps. These allow deposits as low as 5% and 2% in some cases. The Labor Government claimed there would be minimal impact on prices, but early data seems to suggest otherwise with Cotality research director Tim Lawless saying it was “very much a sugar hit to the market”.
The combined capitals were up 2.9% and combined regionals were up 3.5% for the quarter. Sydney was up 0.8% for the quarter and up 5.8% annually. Perth 7.6%, Brisbane 5.6% and Darwin 5.4% saw the largest increases over the quarter. On an annual basis, Darwin was up 18.9%, with Perth and Brisbane up 15.9% and 14.5% respectively. Melbourne (with Sydney) was the laggard capital across the quarter, up 0.8%, with Melbourne also registering the smallest gain annually, up 4.8%. For rents, the national vacancy rate climbed up to 1.7% in December after hitting a record low of 1.4% in September, with rents up 5.2% annually in 2025.
Market Overview
Asset Class Returns
The following outlines the returns across the various asset classes to 31 December 2025.
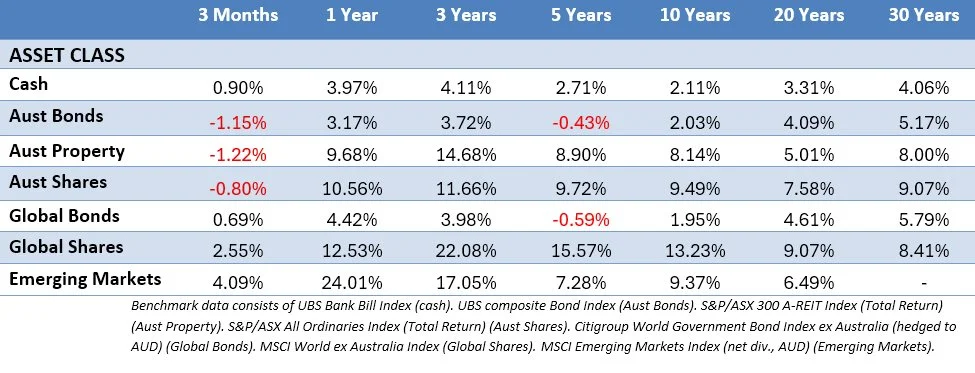
Global stocks notched decent gains again in Q4. The Australian dollar fluctuated between 65 and 67 cents USD finishing slightly higher for the quarter, while also slightly strengthening against the Euro. MSCI World ex Australia (Hedged) was up 3.50% for Q4, while the unhedged index was up 2.55%, a 50/50 split of the two was up 3.04%. US large caps were up 2.66%, while US small caps moved up 2.19%. Global stocks ex US (in USD) were up 5.20% for the quarter. Emerging markets also continued their strong run, up 4.09% and 24.01% for the year. The Australian stockmarket was slightly negative for the quarter, but rounded out the year with a double-digit gain. Australian listed property was down 1.22% in Q4, but up nearly 10% for the year.
Bonds were mostly flat, with little movement in yields, particularly in the US, as the market had mostly accounted for rate movements, but we saw an inflation surprise in Australia which pushed up yields. The 10-Year US Treasury yield didn’t see much fluctuation during the quarter, moving from 4.15% to finish slightly up at 4.17%. US 2-year Treasury Note yields eased during Q4, from 3.61% to 3.54%. In the UK, the 10-year Gilt yield fell from 4.70% to 4.48% with rate cuts and inflation easing. In Australia with rates potentially heading in the other direction, the 10-year yield moved up from 4.31%, to finish at 4.76%. While the 2-Year government bond yield climbed from 3.38%, to finish at 3.79%.
In the US, stocks did ok in Q4, even amid the longest government shutdown on record and rising job cuts. That quarterly gain helped the S&P 500 deliver a 17.88% return, the third straight year of double digits, and a strong recovery after the big sell in April, following the Trump Administration’s tariff announcements. The leaders were again concentrated in the communication and technology sectors, but several cyclical and defensive sectors, including industrials, financials, healthcare and utilities—posted strong, double‑digit gains for the year. Google (Alphabet) 65% and Nvidia 39% were the two members of the “Magnificent 7” with the strongest returns for the year, while Apple, Amazon, Meta (Facebook), and Microsoft lagged the broader market. A signal that AI enthusiasm alone may no longer be driving returns in tech. From a sector perspective, communication services 33.6%, technology 24%, and industrials 19.4% all outperformed the S&P 500. Every sector notched a gain, with consumer staples 3.9%, and real estate 2.7%, bringing up the rear. Small caps, which are more sensitive to interest rate movements, struggled early in the year but came to life in the second half as expectations increased investor interest. The Russell 2000 closed out the year with a 12.81% gain.
In the Eurozone, stocks posted strong gains in Q4, up 5.12% to round out a very good year, with the MSCI EMU up 23.70% in EU terms. In France, the CAC 40 was up 3.21% for the quarter, finishing up 12.28% for the year, while the German DAX was up 2.55%, to finish up 23.16% for the year. As noted, the region outperformed the US with European investor confidence receiving a shot in the arm from continued Fed rate cuts, which helped ease global financial conditions. Financials were particularly strong, seeing benefit from lower interest rates that improved lending prospects, while stable cash flows and dependable dividends in healthcare and utilities stocks attracted interest from investors. At the same time, enthusiasm for growth and technology stocks eased in Europe amid concerns about higher valuations.
In the UK, stocks performed well during Q4, to end 2025 at close to multi-year highs, making it one of the strongest years for UK stocks in over a decade. Despite ongoing concerns about UK economic growth, the market benefited from its international makeup and from investors seeking opportunities outside the US. Performance was led by large, internationally focused companies, particularly in financials, mining, defence and other commodity-linked sectors. These areas benefited from strong global demand, elevated commodity prices, and a slightly weaker pound. In contrast, companies more exposed to the domestic UK economy lagged, as consumer spending remained under pressure and cost challenges persisted. Breaking down by size, the large cap FTSE 100 was up 6.21% for the quarter and 25.82% for the year, with the small and mid-sized companies continuing to lag. The mid cap FTSE 250 was up 2.06% and 9.67% for the year, and UK small caps were up 3.67%, and 10.89% for the year.
In Japan, the stockmarket extended its rally, with the TOPIX Total Return up 8.8% and the Nikkei 225 up 12.03% for Q4. Full year returns finished at 22.41% and 28.76% respectively, in local currency terms. Throughout the year, expectations of strong growth in generative AI and defence spending globally supported sector related stocks and broader Japanese market sentiment, but there were mounting valuation concerns in these same areas that increased volatility as the year rounded out. While valuations are nearing the high end of historical ranges, corporate earnings have been solid and ongoing corporate governance reforms a positive.
Asia (ex-Japan) and Emerging markets posted strong Q4 returns, with MSCI AC Asia ex Japan Index up 3.41% in Australian dollar terms, while the MSCI Emerging Markets Index was up 4.09%. For the full year, the pair were up 22.67% and 24.01% respectively. One of the key drivers of returns were the tech orientated markets of South Korea and Taiwan. South Korea was the best-performing market in the emerging market index for the quarter, as it also sealed a new trade agreement with the US seeing tariff reductions and direct investment. The Chilean market was up strongly over the quarter, supported by strength in commodity prices. South Africa also posted strong returns helped primarily by rising precious metals prices. Taiwan’s outperformance was driven by continued demand for tech stocks throughout the quarter. The Brazil market finished ahead of the broader EM index, despite a mixed macro backdrop. The Indian market performed in line with the emerging market index as improving macro data indicators and an interest rate cut proved supportive. China lagged in Q4, despite performing well for much of 2025, with the final quarter seeing the market giving back some gains. Softer economic data and increasing concerns about ongoing weakness in the property market, particularly following the near default in December of the country’s largest property developers, significantly weighed on the market.
In Australia, the ASX 300 was down -0.89% in Q4, with the majority of sectors in the red. In fact, it was only materials posting any sort of gain, up 13%, with the big miners holding up the market, the other sectors to post a slight gain were energy, up 0.93%, and industrials up 0.61%. On the red side, the worst performer was information technology down -23.72%, as Australia’s biggest tech names Wisetech and Xero continued their torrid run, while Technology One and Nextdc also offered no support. Consumer discretionaries were the other sector to see a double digit decline in Q4 as Wesfarmers and Aristocrat pulled the sector down. CBA continued its selloff in Q4, after hitting a record high in late June 25 it shed over 16% through the rest of the year, the majority of it in Q4. Finally, the ASX Small Ordinaries index was up 1.80% for Q4, but that still capped off a strong year with a 24.96% return, the first return over 20% since 2019 and the strongest return for the index since 2009.
This material is provided for information only. No account has been taken of the objectives, financial situation or needs of any particular person or entity. Accordingly, to the extent that this material may constitute general financial product advice, investors should, before acting on the advice, consider the appropriateness of the advice, having regard to the investor’s objectives, financial situation and needs. This is not an offer or recommendation to buy or sell securities or other financial products, nor a solicitation for deposits or other business, whether directly or indirectly.
With thanks to FYG for this article